Data Sonification of Weather Disasters [USA, 1970 — 2021]
Fires, Severe Storms, Floods, & Hurricanes
{January 2023}
{January 2023}

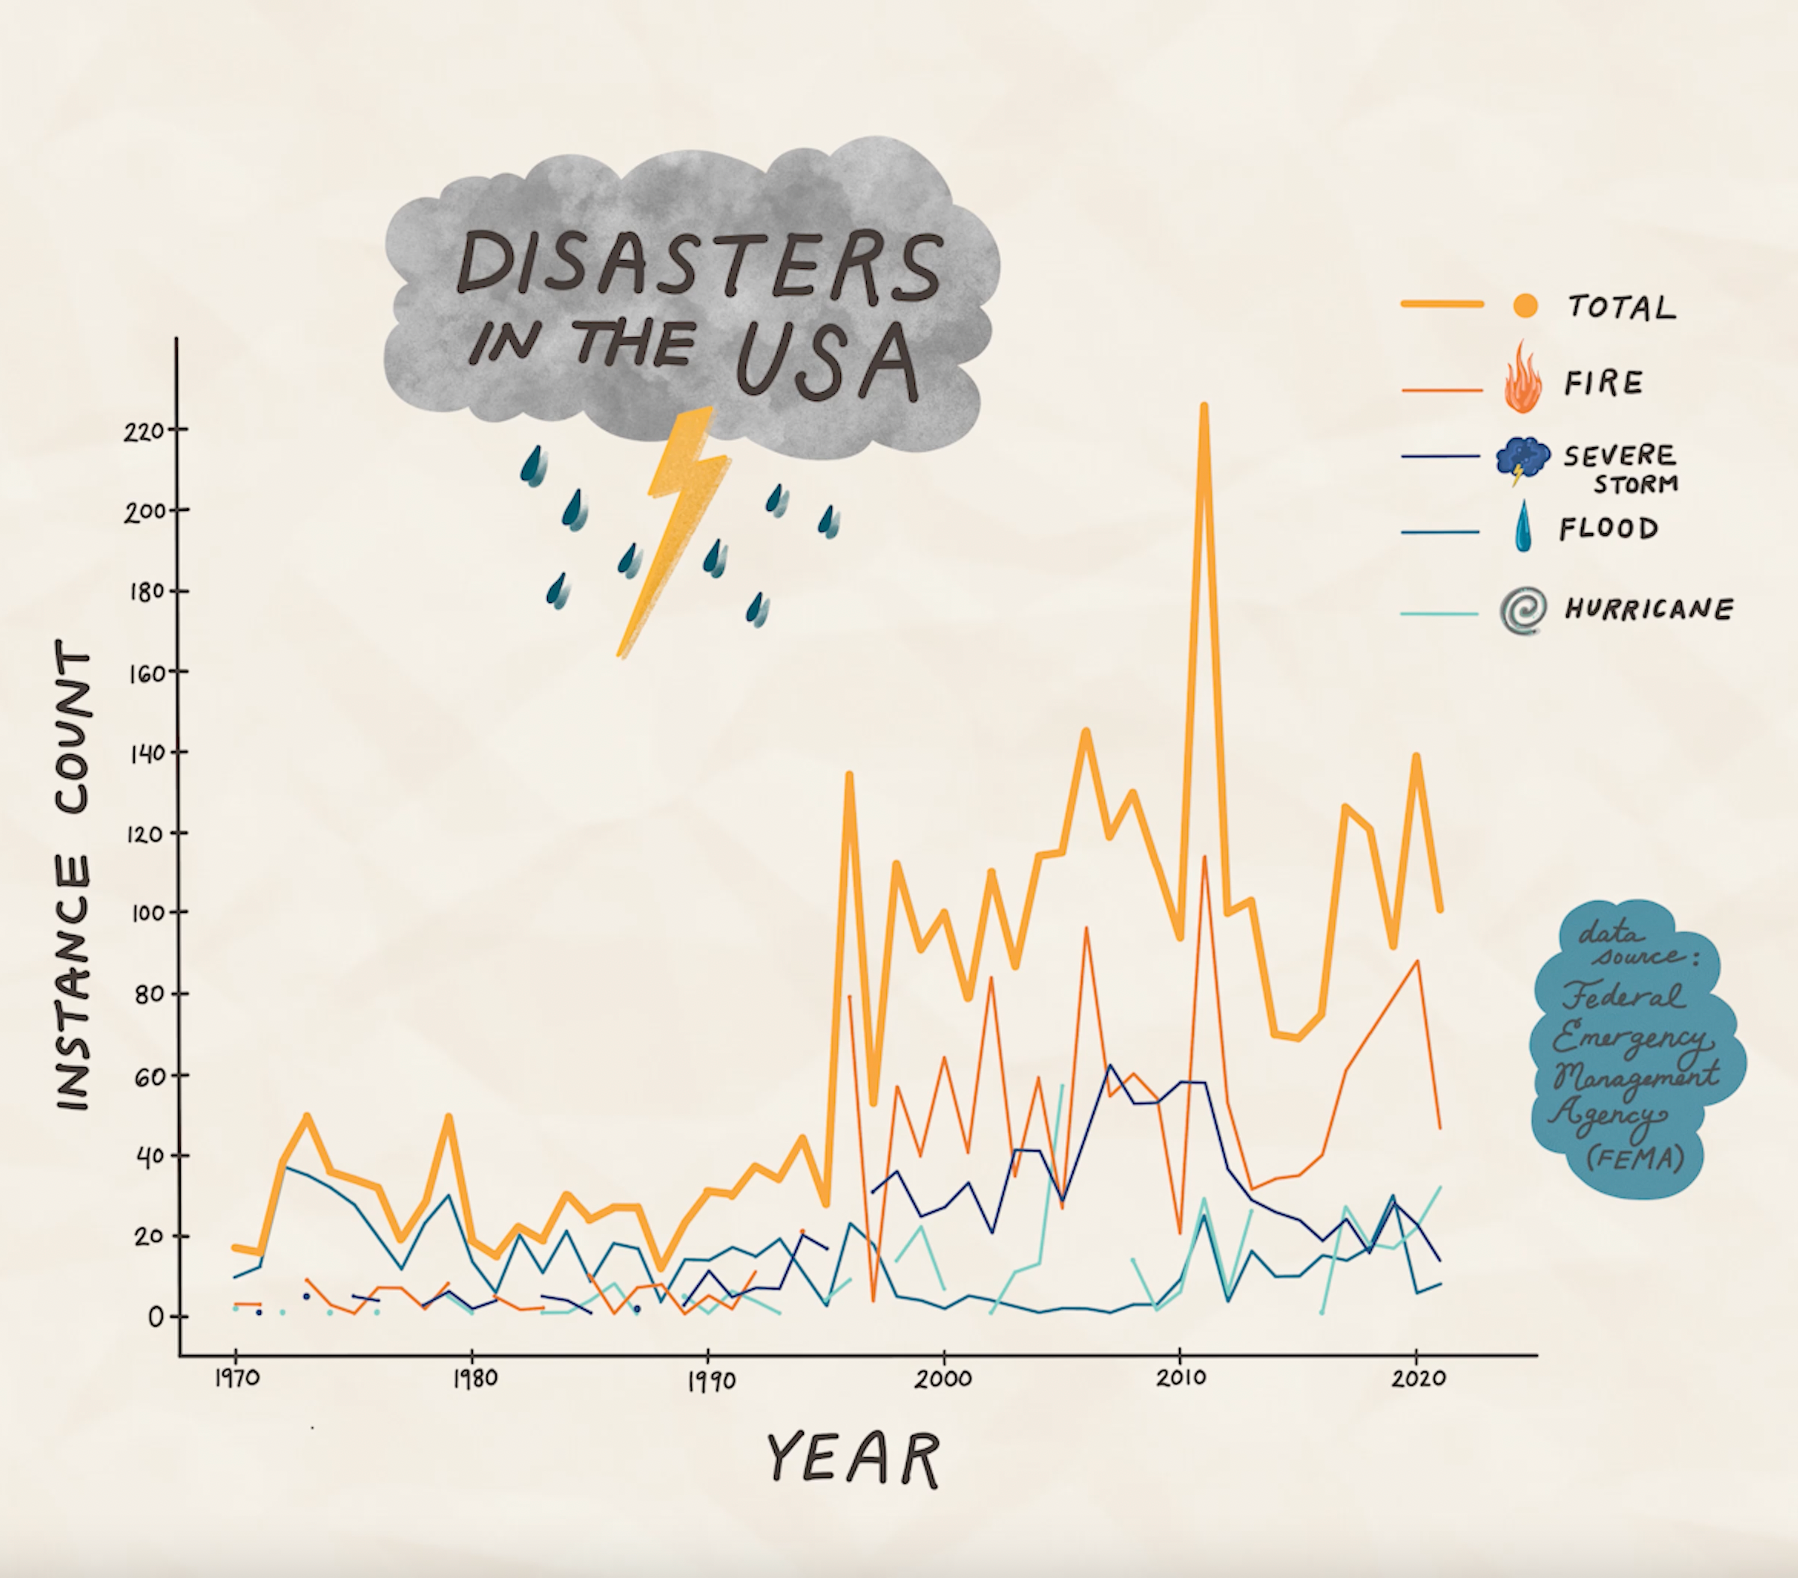
What natural disasters have been most prevalent in the USA since 1970?
For my second data sonification project, I wanted to focus on something that was more sonically intuitive than my last Lord of the Rings sonification exploration.
(As fun as it was, I realized it might be difficult for a listener to understand the meaning of the sounds without a visual reference or sonic lexicon!)
I wanted to create a time-based sonification, and associate numeric value with pitch. A friend of mine suggested the idea of creating a natural disaster-focused project. After some investigation I found the Open FEMA Data resource.
Considering the most prevalent disaster types in the disaster declaration data over time (fires, severe storms, hurricanes, and floods), I investigated the disaster frequency trend from the last few decades.
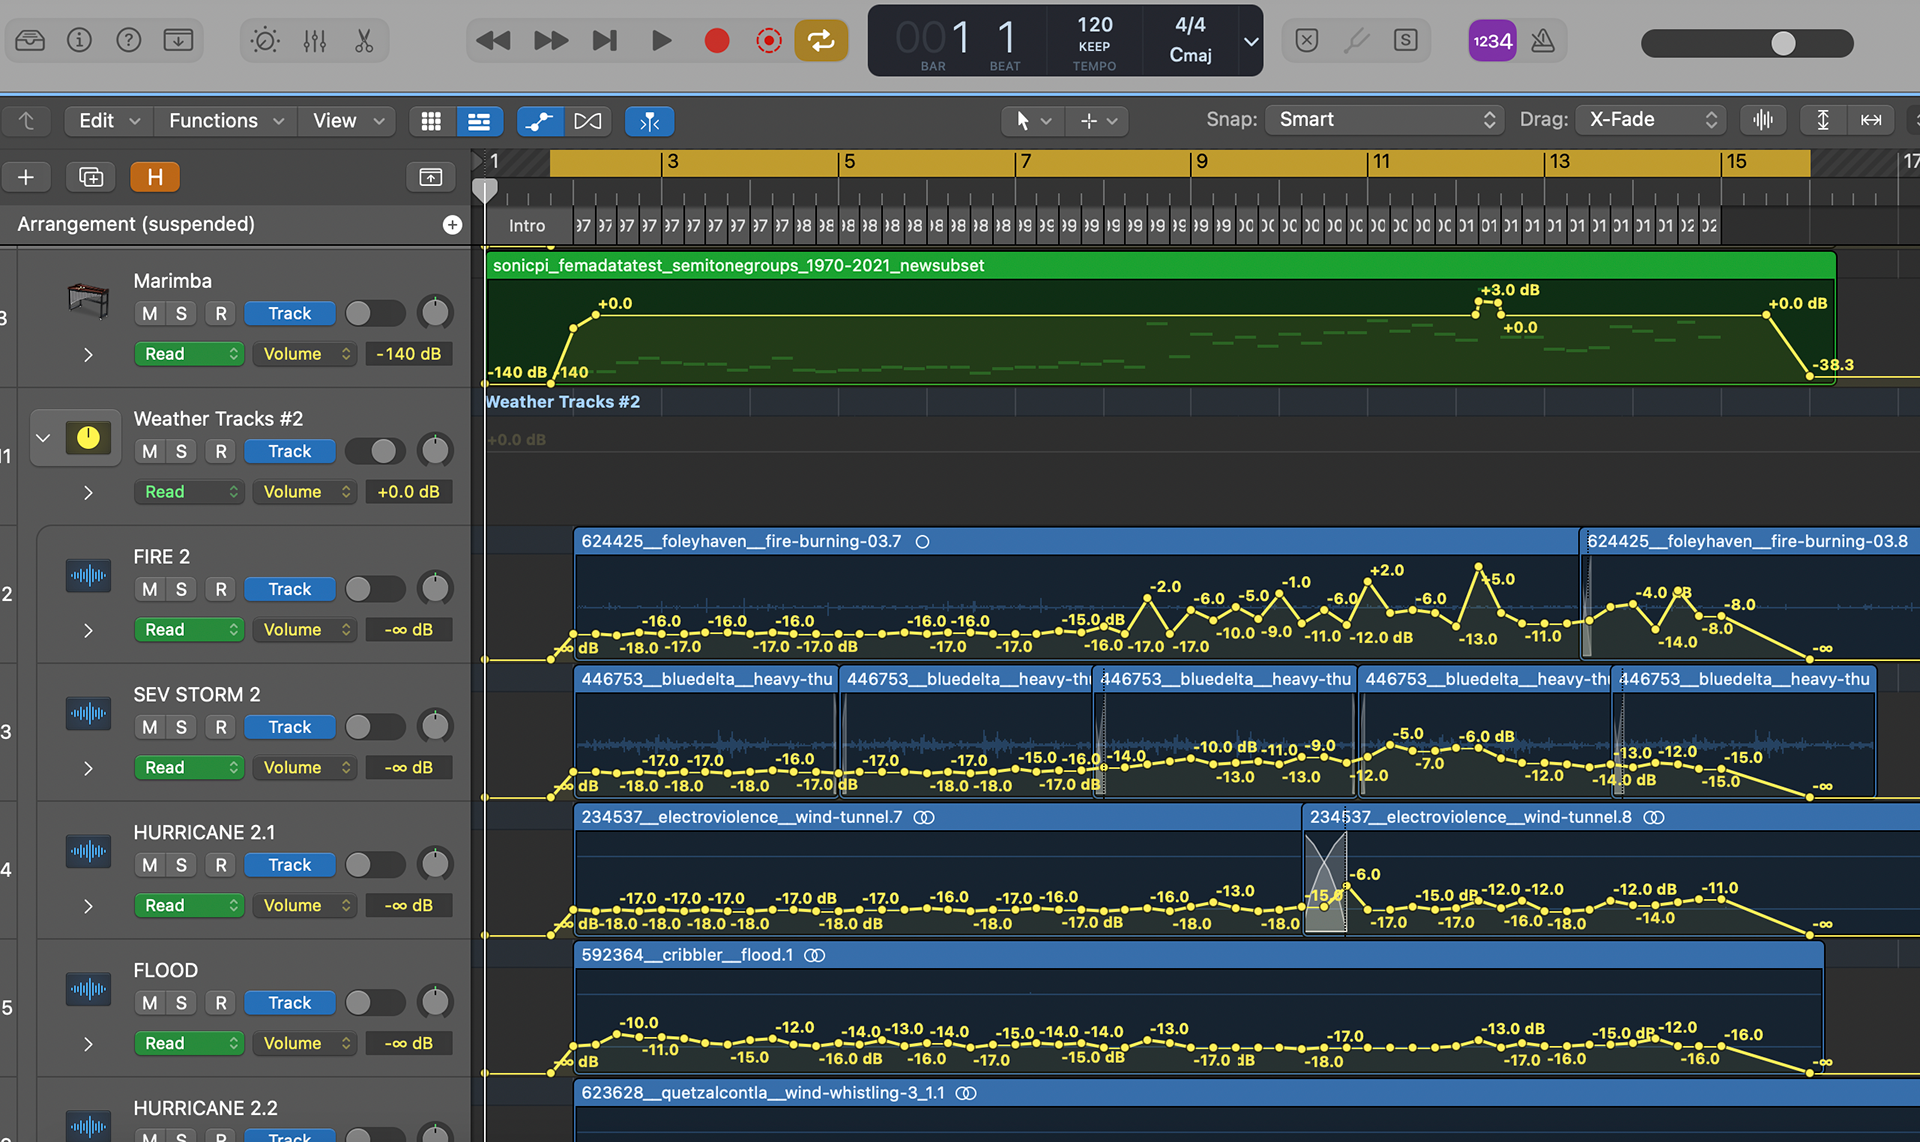
I decided to associate the numeric count of total disasters per year with pitch (higher pitch = higher frequency), and associate the individual yearly disasters with amplitude similarly. The total count is represented by a marimba, and the individual disaster types are represented by weather sound sample tracks. More ambient than anything, you can hear a crackling fire, a rumbling storm, whistling wind, and rushing water to represent fires, severe storms, hurricanes, and floods, respectively.
Below is the sonification, accompanied by an animated visualization I created to pair with it:
Method Details
The R script, datasets, Sonic Pi scripts and output, as well as the sonification audio bounce can be found in the GitHub repository linked at the top of this page.
1. I pulled in the data from the Open FEMA API, then cleaned and analyzed it.
2. I converted the total disaster instance count values into a normalized scale of frequencies that would be audible in Sonic Pi.
I converted the individual disaster count values into a normalized scale of decibel values that would be audible in the mixing process.
3. I used Sonic Pi to record the frequency array that I had assessed in R.
4. In Logic Pro X, I converted the frequency recording from Sonic Pi into a MIDI track so that I could apply different software instruments.
5. I imported sound samples from freesound.org, mixed them, normalized their volumes to have a comparable baseline, and applied the decibel change levels across each track.
6. I exported the resulting audio from Logic Pro X.
7. Using a plot I had generated in R as reference, I created an animated visualization to accompany the sonification, using Procreate and Adobe Photoshop.