Exploring Math and Physics with Data Sonification
How educators can use sound to teach STEM
How educators can use sound to teach STEM

Sound and data. How might these two concepts relate?
It’s been a winding path to find the links between my passions for data, audio, and art. When I came across the space of data sonification, it was like stumbling into a community to which I belonged but never knew existed.
Data sonification = the act of translating data into sound = a perfect union of data and audio.
Sonification is part of a larger category, called auditory display, which includes any use of sound to convey information. We’re so accustomed to looking at a chart to see a data trend, perhaps even jaded by it, but what about listening to that trend? Sonification has the power to expand data accessibility and augment one’s experience of information consumption.

I have been collaborating with the Georgia Tech Sonification Lab to continue learning about the niche field of sonification and work on audio-visual projects. One aspect of this collaboration has involved testing the Highcharts Sonification Studio (a web application co-created by Georgia Tech and Highcharts) and generating sonification output with this tool.
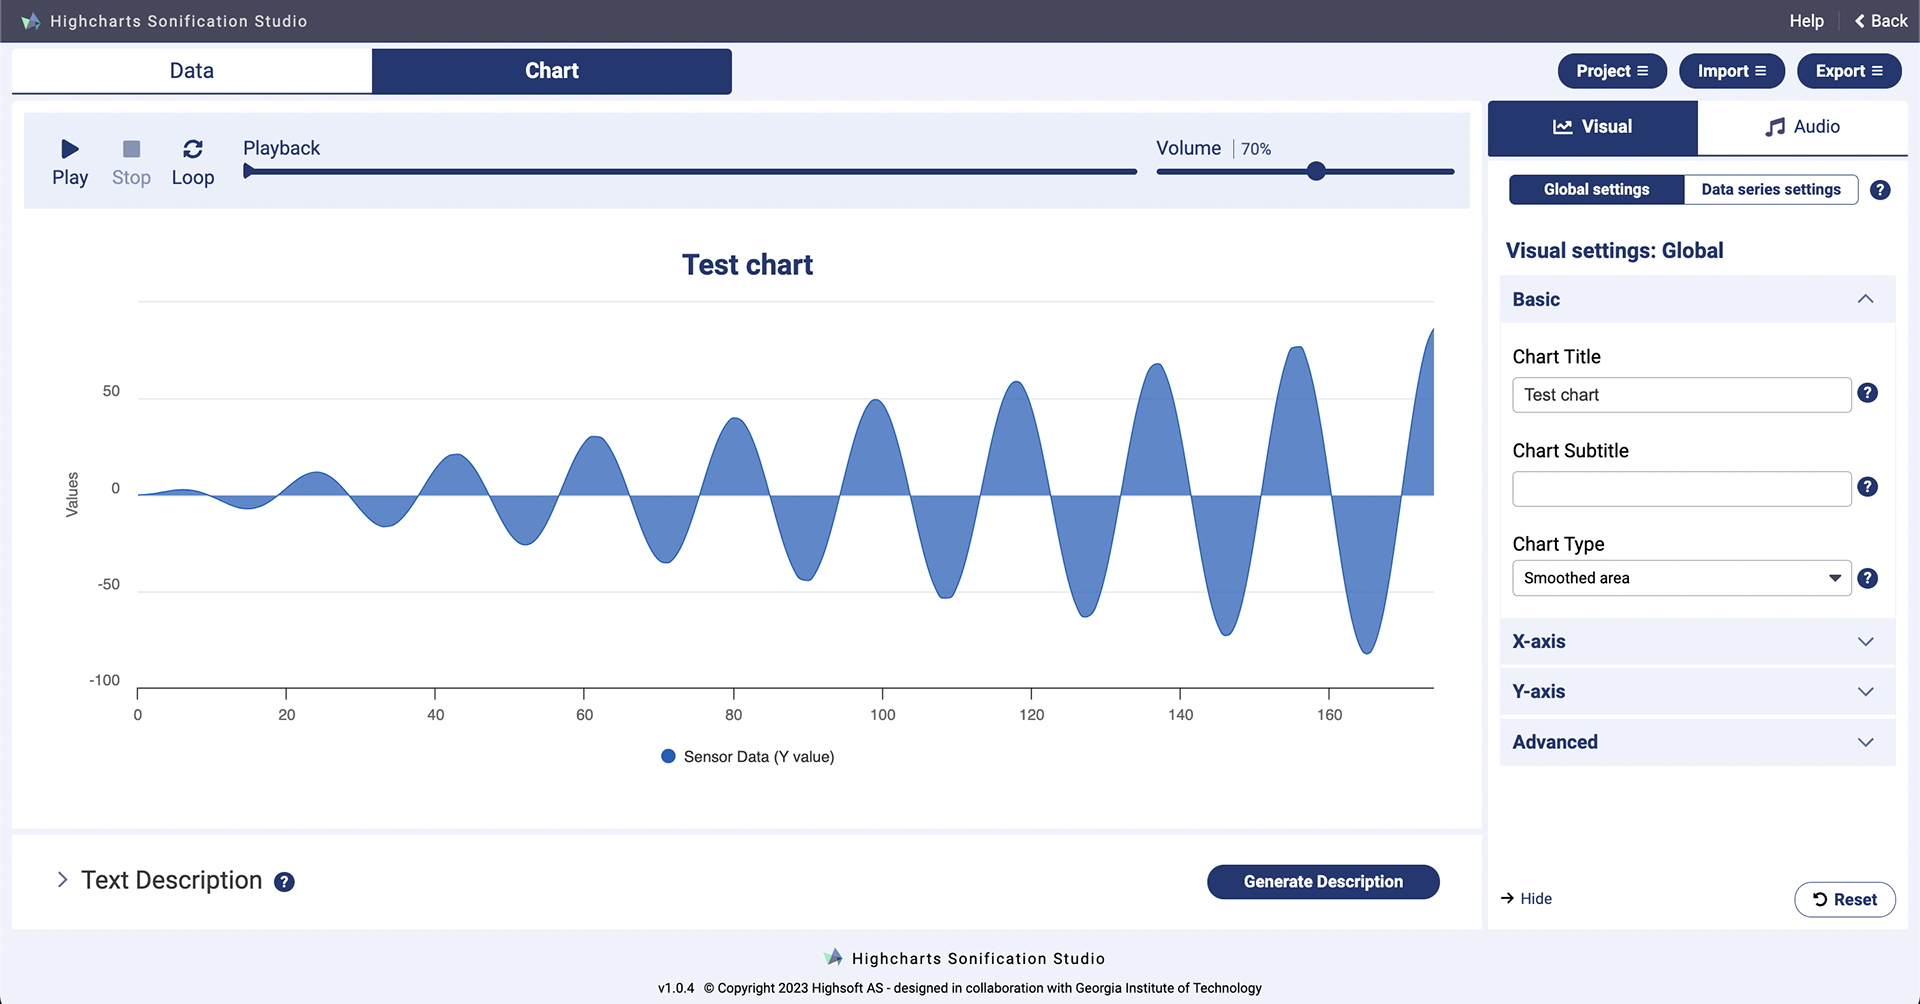
Click on the image to visit the application.
One application of data sonification is in the educational space - imagine teachers using sound to teach basic math or physics concepts? Making the lesson multi-sensory could not only improve engagement, but could also make the concepts more accessible for blind and visually-impaired students.
With this as a potential application of the sonification studio, and the need for some prototypes, I generated a handful of basic math sonification demonstrations using HSS.
Below are some recordings of these sonification examples in HSS:
First sound: How the velocity of a falling object increases over ten seconds; as velocity increases, pitch increases.
Second sound: The distance covered by a falling object; as more distance is covered, pitch decreases.