Visualizing COVID-19 Cases Worldwide
November 27th, 2020
Please visit the published version on my RPubs profile for the complete project.
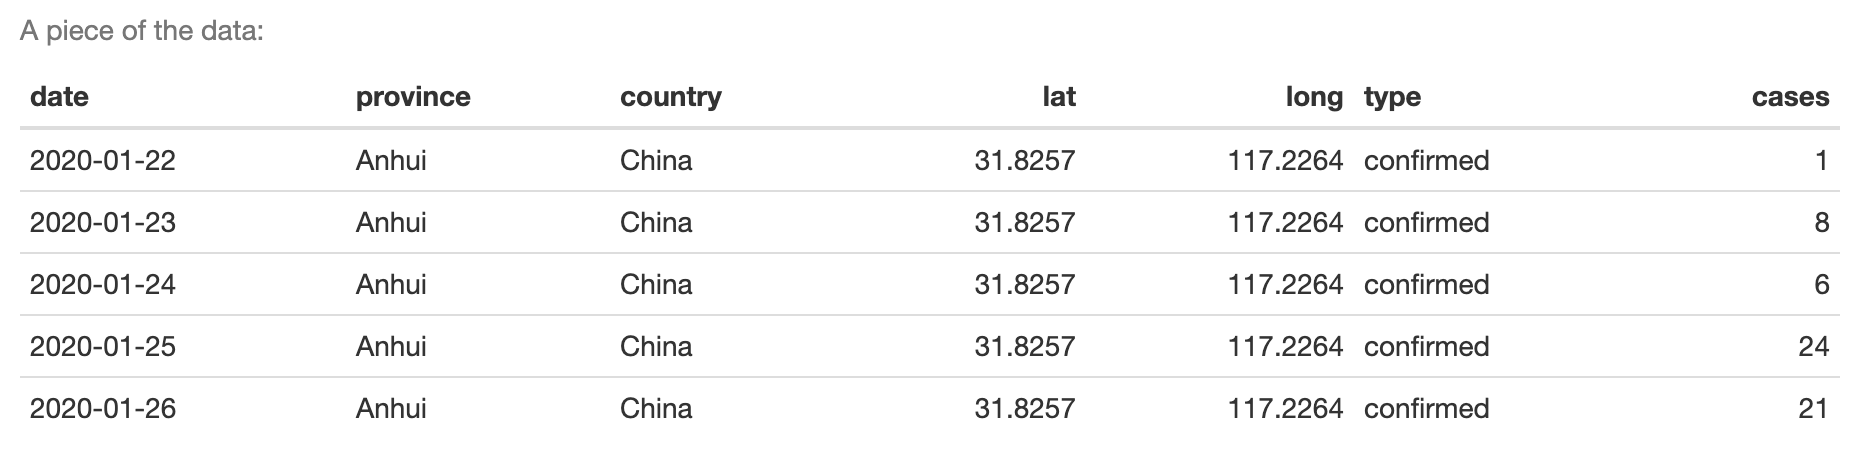
This exploration is based on a project from DataCamp.com, found here: https://projects.datacamp.com/projects/870. The goal here is to explore the trends in COVID-19 cases over time by country. The data is regularly updated, and I pulled an updated version of it on November 27th, 2020. Data accessible here: https://github.com/RamiKrispin/coronavirus/tree/master/csv.
To visualize the trend in confirmed COVID-19 cases worldwide, I create a new data frame consisting of date, worldwide total on a daily basis, and the running cumulative number of cases up to a given date. Below is a plot of cumulative worldwide cases over time.
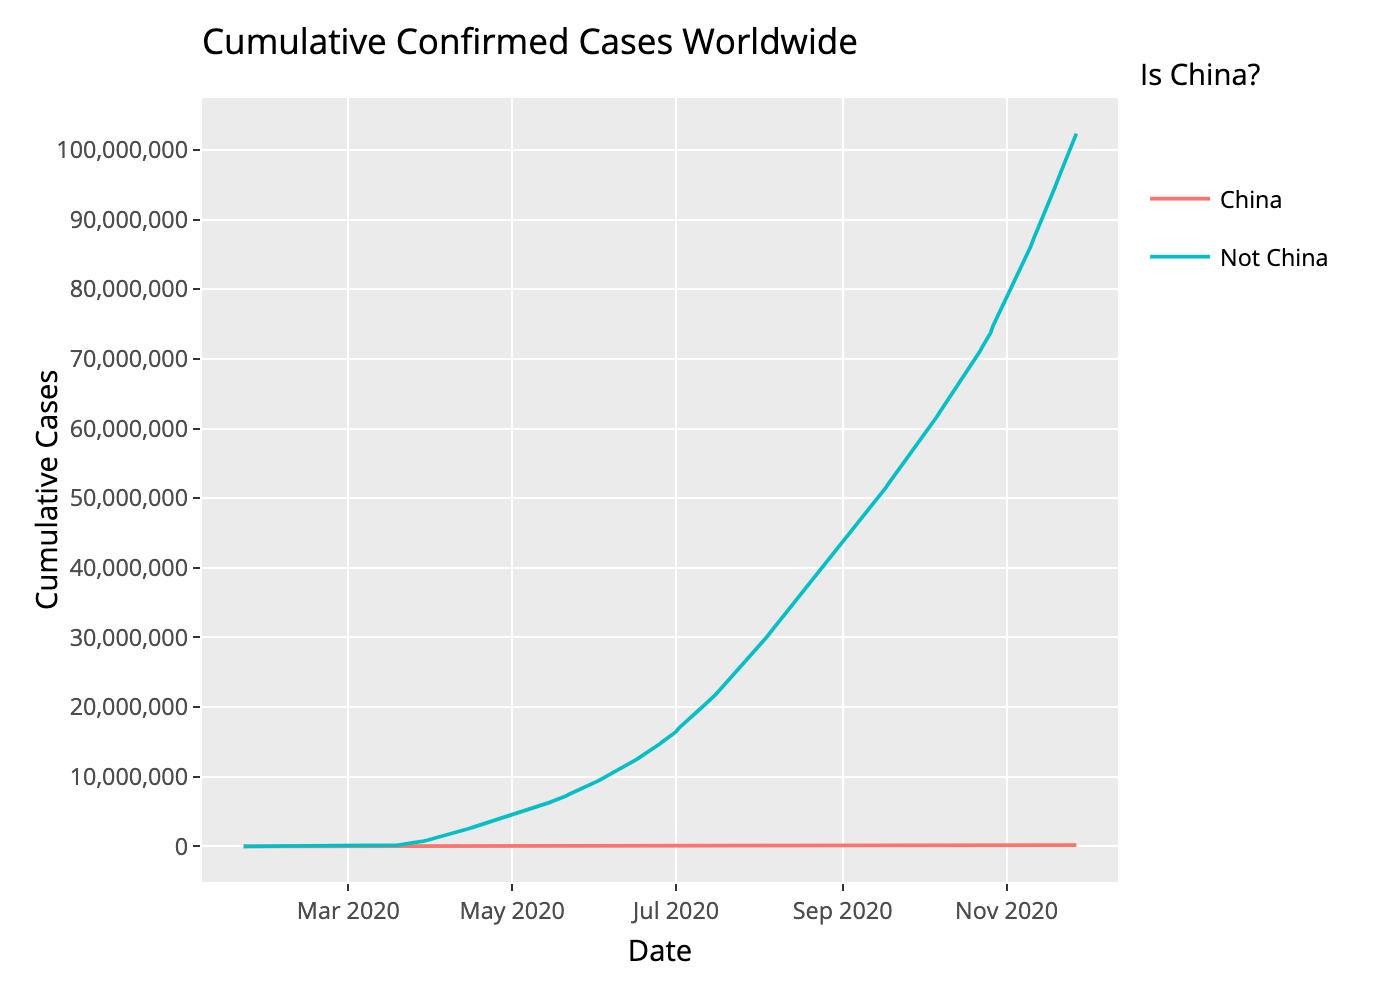
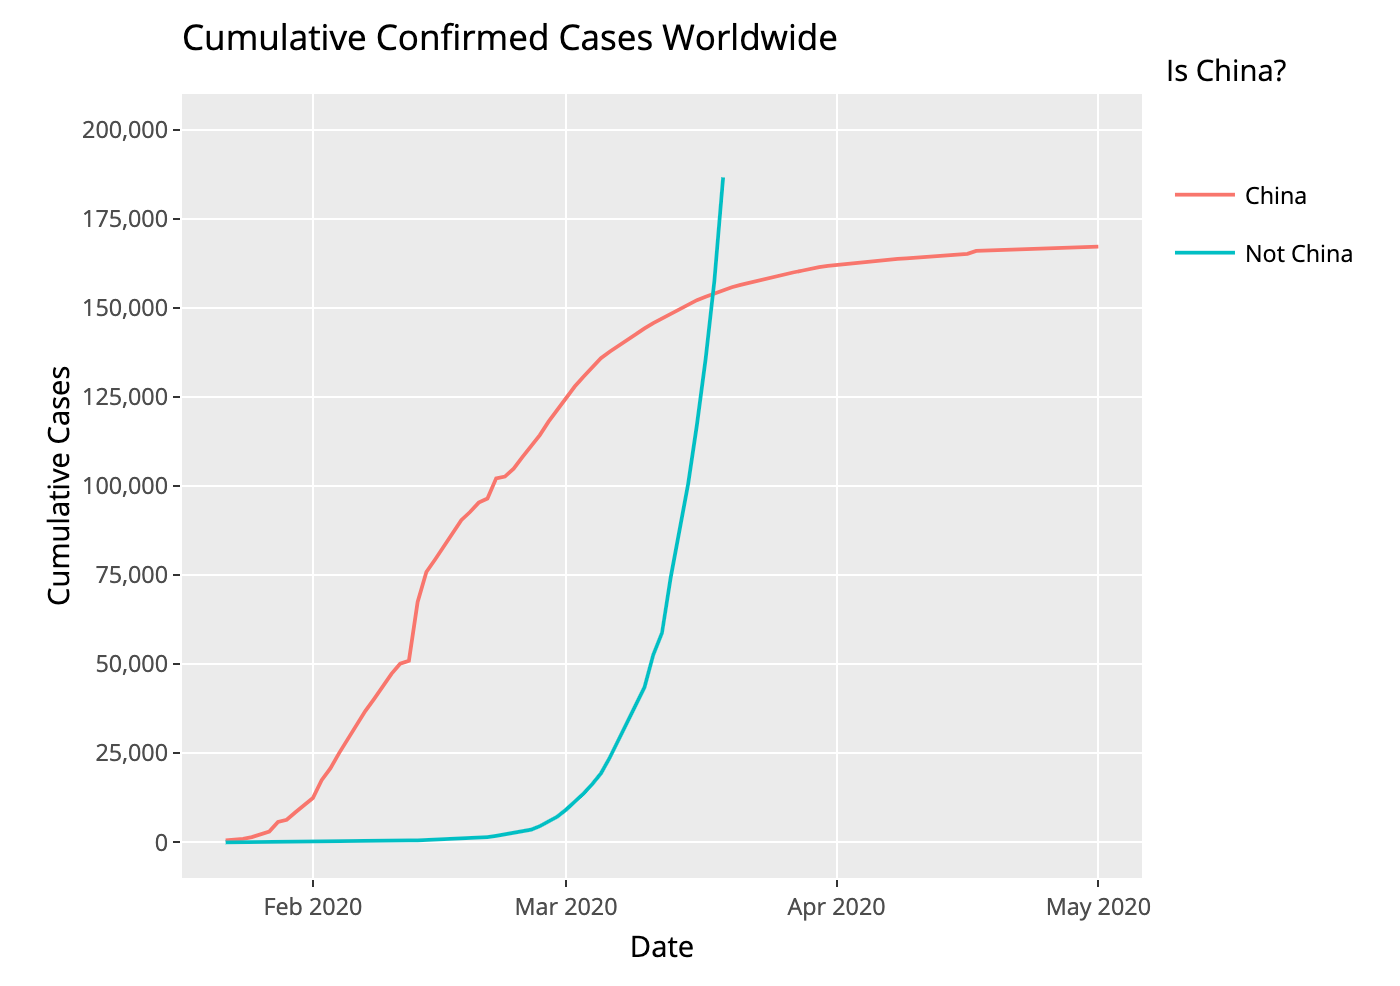
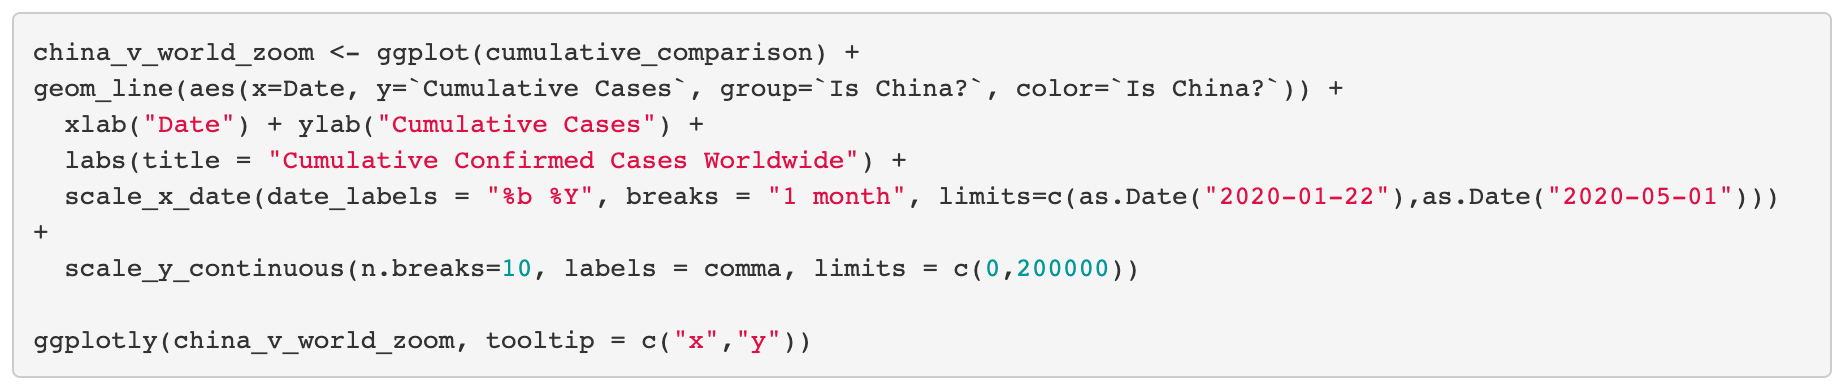
Snippet of code for generating the zoomed-in China vs. World cases: